Businesses generate data every day, but having data is not enough.
A Business Analyst needs to help people understand what that data is saying. 🔎
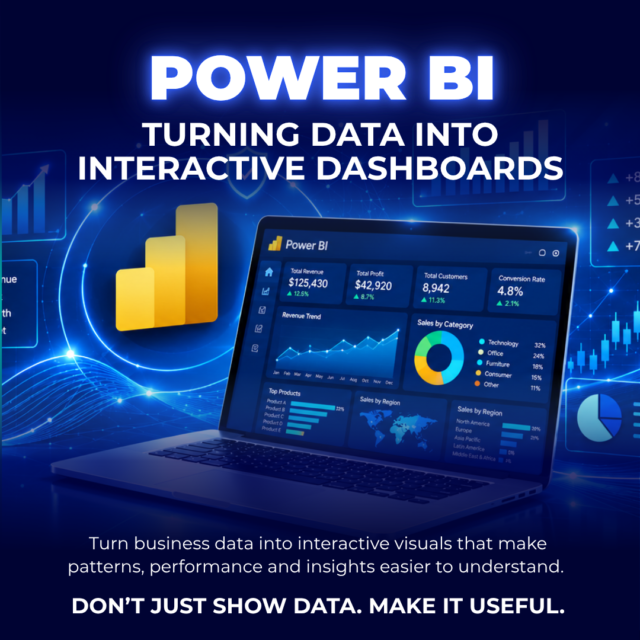
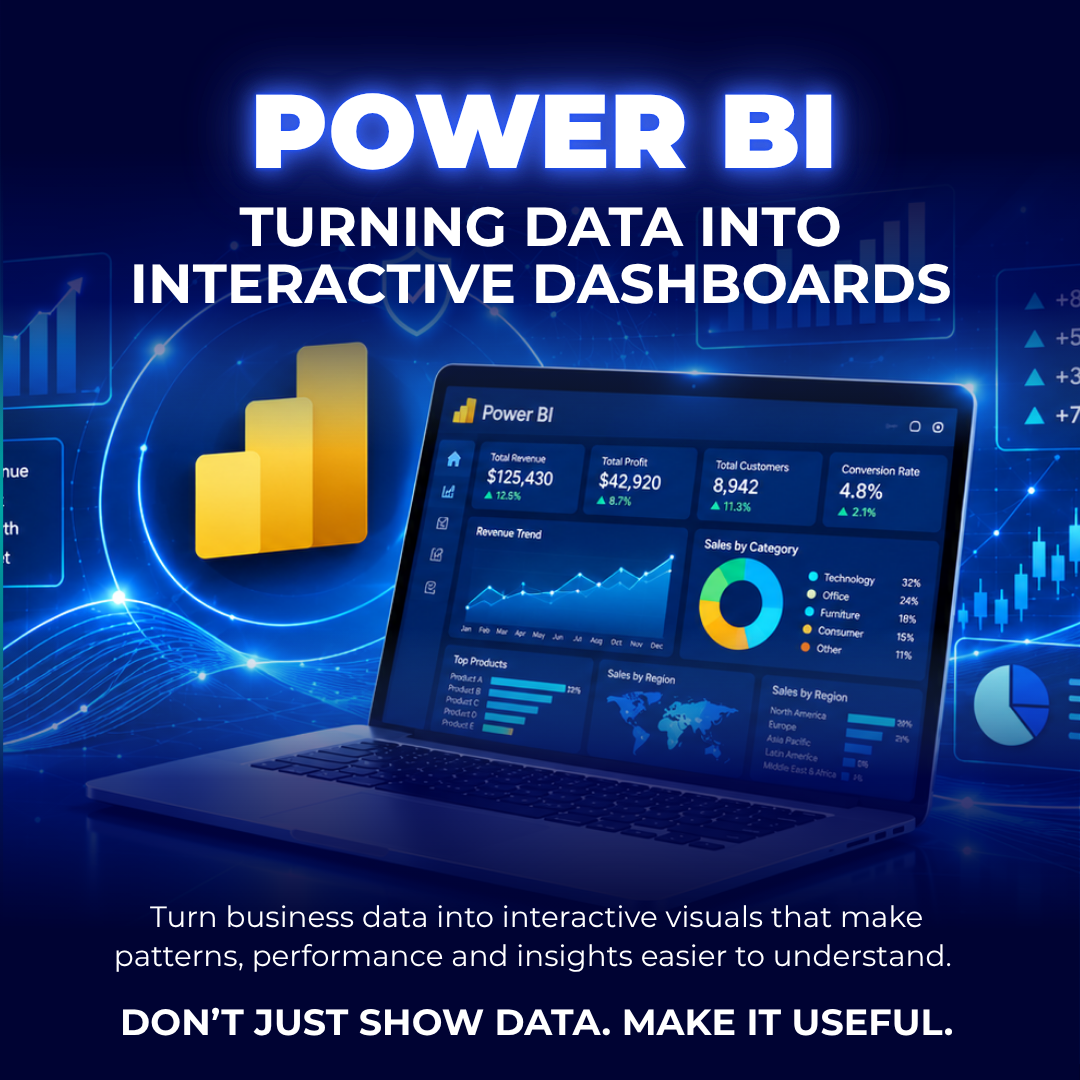
Power BI helps BAs transform business data into interactive dashboards and visual reports.
A BA might use it to track sales, KPIs, product performance, regional trends or customer behaviour.
The BA’s role is not simply to make a dashboard look good. It is to identify what matters, present it clearly and help decision-makers understand what is happening.
The process is:
DATA → VISUALISATION → INSIGHT → ACTION 🎯
https://www.linkedin.com/feed/update/urn:li:activity:7508336445837918209